
Development of a procedure manual for assessing eutrophication status
CEARAC has developed methodologies for assessing the status of eutrophication using remote sensing technology. In 2009, we developed the “Procedures for assessment of eutrophication status including evaluation of land-based sources of nutrients for the NOWPAP region (NOWPAP Common Procedure)” [1]. Then, we conducted case studies in the selected areas of the NOWPAP region to verify the validity of the procedures, and published revised versions in 2013 and 2015. [2, 3]. In the revised “NOWPAP Common Procedure” of 2013, the procedure for assessing eutrophication status was divided into two parts. In the first part, the screening procedure (first diagnosis), a preliminary assessment of eutrophication is conducted using the minimum necessary three parameters. In the second part (comprehensive procedure), a more detailed analysis is conducted to perform a comprehensive eutrophication assessment, targeting only those areas where signs of eutrophication are identified in the first diagnosis. By selecting target areas based on the first diagnosis, the second diagnosis can be made efficiently. Furthermore, in the 2015 revised edition of the NOWPAP Common Procedure, the required parameters in the procedure were reviewed, and one of them (Nutrients input and their residence time) was changed to Long-term Trend of Chemical Oxygen Demand (COD) or Total Organic Carbon (TOC).
References
[1] NOWPAP CEARAC, “Procedures for assessment of eutrophication status including evaluation of land-based sources of nutrients for the NOWPAP region”, (the NOWPAP Common Procedure , 2009).
[2] NOWPAP CEARAC , “Procedures for assessment of eutrophication status including evaluation of land-based sources of nutrients for the NOWPAP region” , (the NOWPAP Common Procedure 2013 Revised Edition)
[3] NOWPAP CEARAC, “Procedures for assessment of eutrophication status including evaluation of land-based sources of nutrients for the NOWPAP region “, (the NOWPAP Common Procedure 2015 Revised Edition)
Assessment of eutrophication status
CEARAC conducted a preliminary assessment of the eutrophication status in the NOWPAP region in accordance with the screening procedure (first diagnosis) outlined in the “NOWPAP Common Procedure,” using the following three minimal parameters:
(1) Trend of chemical oxygen demand (COD) or total organic carbon (TOC)
(2) Red tide and hypoxia events
(3) Satellite derived Chlorophyll-a concentration (CHL)
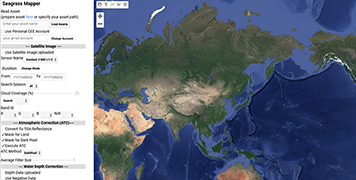
The results of the “Preliminary assessment of eutrophication” are available on the CEARAC Web-GIS: https://cearac.nowpap.org/map-webgis/.
The color of the circles indicates the eutrophication status of each area.
●”Non eutrophic” area: Only one of the three parameters shows a sign of eutrophication.
●”Potentially eutrophic” area: Two of the three parameters show signs of eutrophication.
●”Eutrophic” area: All three parameters show signs of eutrophication.
●”Improved” area: Either (1) or (2) of the three parameters above shows an improving sign in the eutrophication status.
Areas classified as “Potentially eutrophic” or “Eutrophic” in this first diagnosis will be further evaluated in the comprehensive assessment (second diagnosis).
The assessment results for each parameter can also be viewed on the CEARAC Web-GIS.
(1) Trend of COD
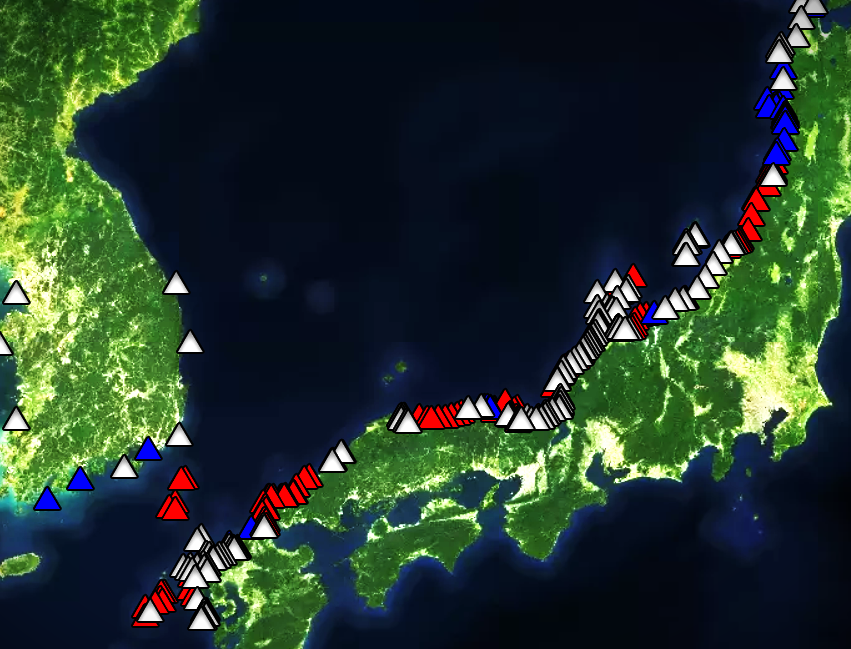 ‘△’ on the CEARAC Web-GIS map is COD monitoring stations.
‘▲’ showing increasing trend;
‘▲’ showing decreasing trend;
or ‘▲’ showing no significant change.
Then, the areas marked ‘▲’ are regarded as showing a symptom of eutrophication.
A long-term trend in annual mean of COD in a regular monitoring sampling station in the NOWPAP sea area is collected, which is detected by the Mann-Kendall test.
(2) Red tide and hypoxia events
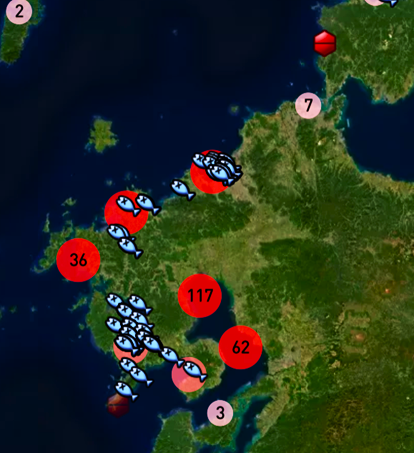 The size and the number of each ‘〇’ on the CEARAC Web-GIS map shows
the spatial distribution of red tide occurrences.
Areas of red tides with fishery damages are shown with bright red images ![]() and without fishery damages are shown with dark red images
and without fishery damages are shown with dark red images ![]() .
.
Exhausted fish images ![]() indicate hypoxia.
indicate hypoxia.
When clicking each image, detailed information about the occurrence is obtained.
More than one event of red tide or hypoxia in the target sea area in the recent three years is regarded as a symptom of eutrophication.
(3) Satellite derived Chlorophyll-a concentration (CHL)
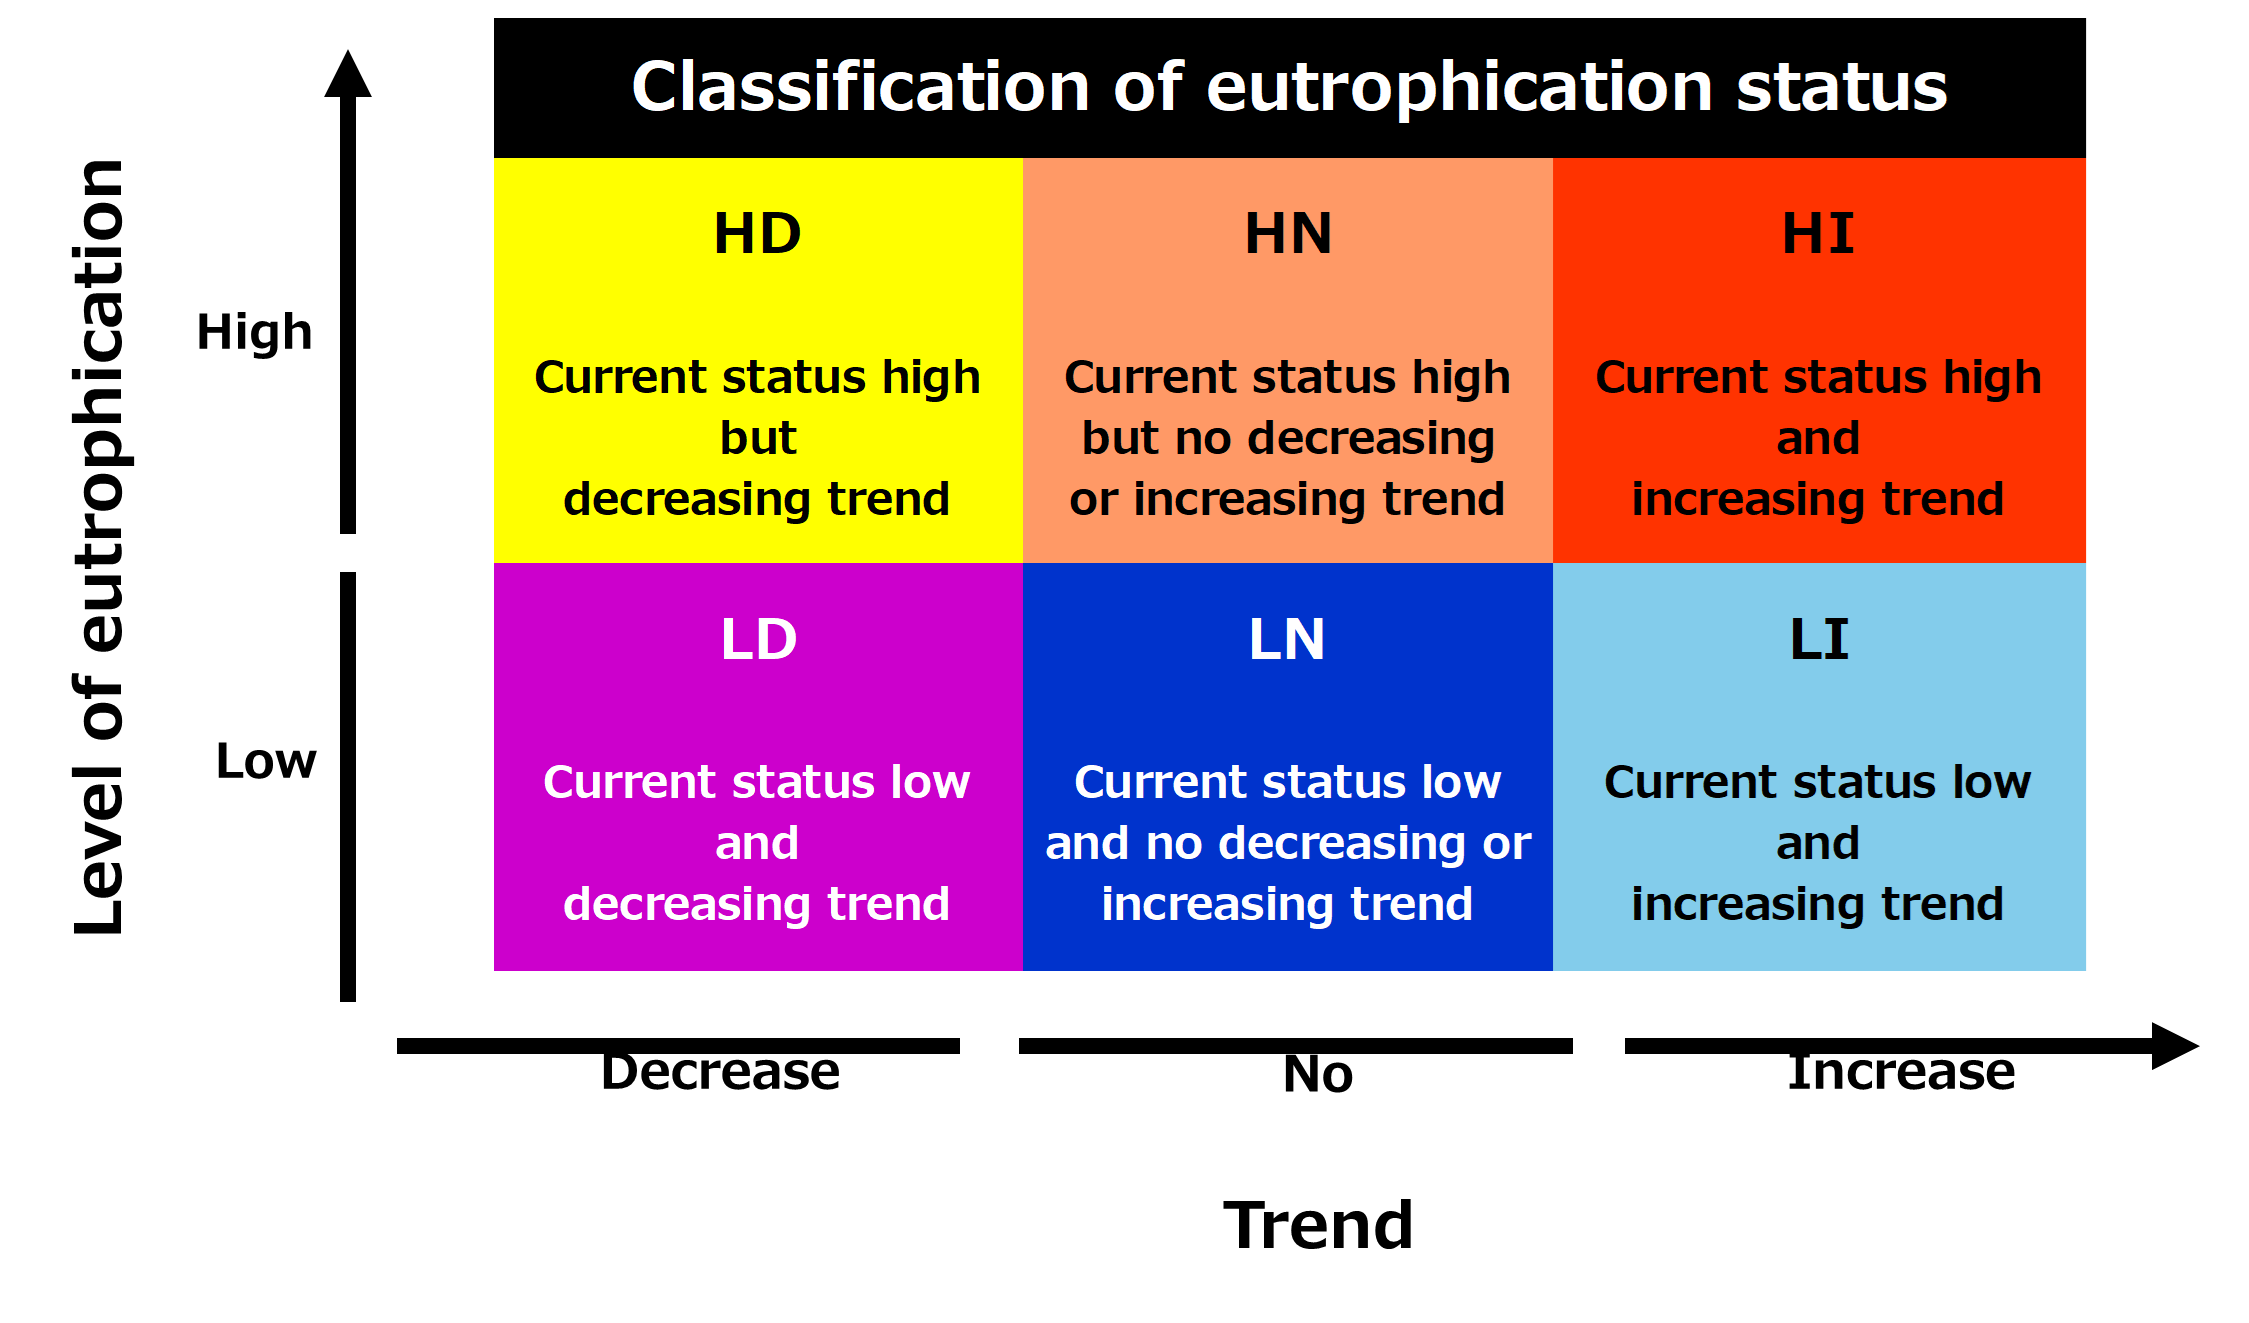
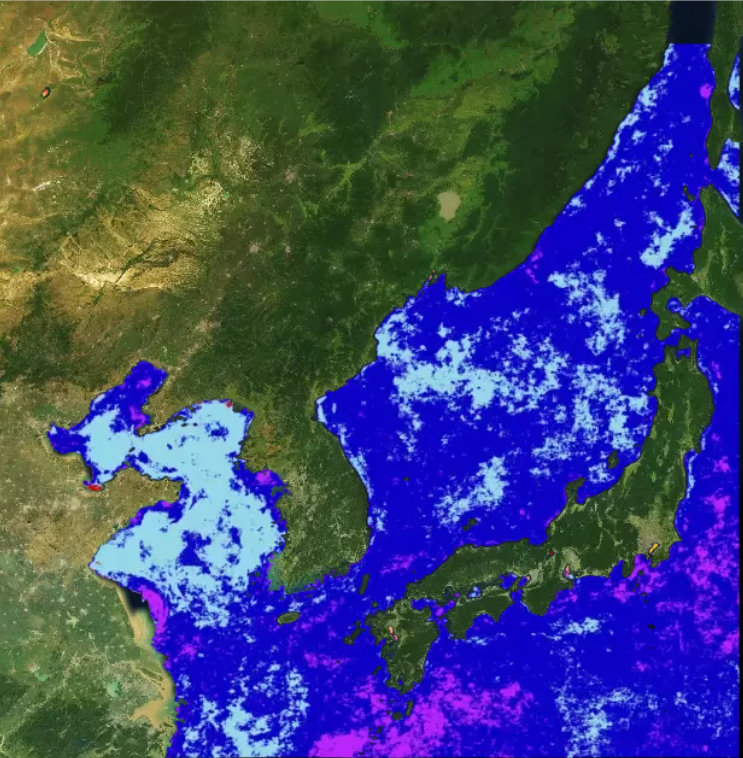 On the CEARAC Web-GIS map, satellite-derived Chlorophyll-a concentration in the NOWPAP region can be viewed. The eutrophication status is color-coded into six categories in the table below based on a combination of CHL levels and trends. The classification method is as follows: 5 ug/L is set as a reference value for the level, which is the low end of Middle of Chl-a criteria (5~20 μg/L) shown by Bricker et al. (2003). Then, the areas are divided into two categories, either ‘high status’ (5 ug/L or higher) or ‘low status’ (lower than 5μg/L). Next, the trend is derived from annual max values of each pixel and classified as either ‘Increase’, ‘Decrease’ or ‘No trend’.
Classification of either HN or HI is regarded as a symptom of eutrophication.LI and HI indicate an increasing trend in CHL, and particular attention is required in these areas since their eutrophication status is assessed as “worsening” or “eutrophic”.
List of experts involved in CEARAC eutrophication assessment activities
as of 2017
| Dr. Zhiming YU |
Professor |
Chinese Academy of Science Institute of Oceanology, China |
| Dr. Zaixing WU |
Professor |
Chinese Academy of Science Institute of Oceanology, China |
|
Dr. Yasuo FUKUYO |
Professor Emeritus |
University of Tokyo |
|
Dr. Joji ISHIZAKA |
Professor |
Institute for Space-Earth Environmental Research, Nagoya University |
|
Dr. Osamu MATSUDA |
Professor Emeritus |
Hiroshima University |
|
Dr. Genki TERAUCHI |
Senior Researcher |
Research & Study Department, Northwest Pacific Region Environmental Cooperation Center |
|
Dr. Chang-kyu LEE |
Senior Scientist |
Fishery and Ocean Information Division |
|
Dr. Seung Ho BAEK |
Principal Researcher |
Risk Assessment Research Center, |
|
Dr. Pavel TISHCHENKO |
Leader Scientist of Hydrochemistry Laboratory |
V.I. II’ichev Pacific Oceanological Institute, |
|
Dr. Vladimir SHULKIN |
Head |
Laboratory of Geochemistry, Pacific Geographical Institute, |


