
This page introduces web tools of CEARAC as part of its activities to develop new monitoring and assessment tools using marine remote sensing technique.
These tools are developed by Google Earth Engine (GEE), a cloud-based computer platform to help users analyze satellite data and imagery.
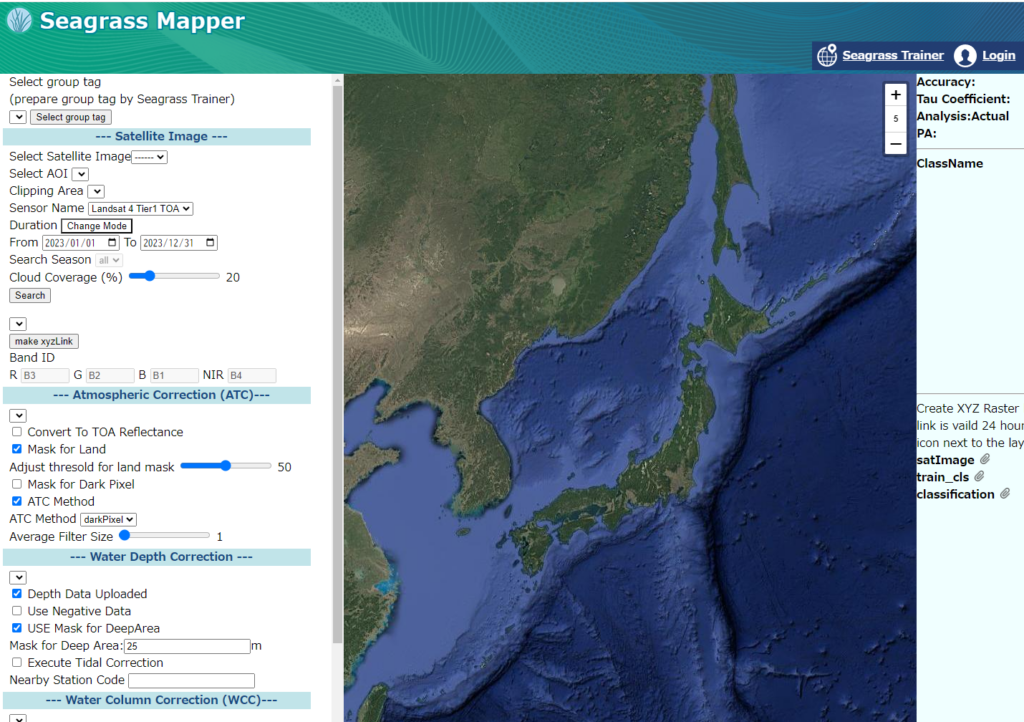
Seagrass Mapper is a cloud-based web tool to visualize seagrass beds on a map, using satellite imagery and field data.
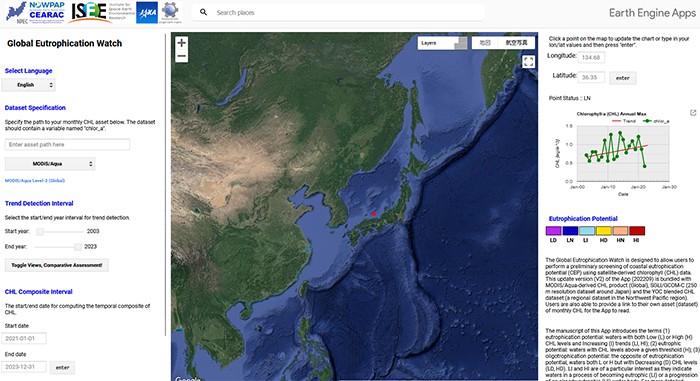
Global Eutrophication Watch can preliminarily detect the eutrophication or oligotrophication potential of target areas by classifying marine water into six classes; three associated with CHL trends (D-decreasing, N-no trend, and I-increasing) and two with CHL levels (H-high, L-low).
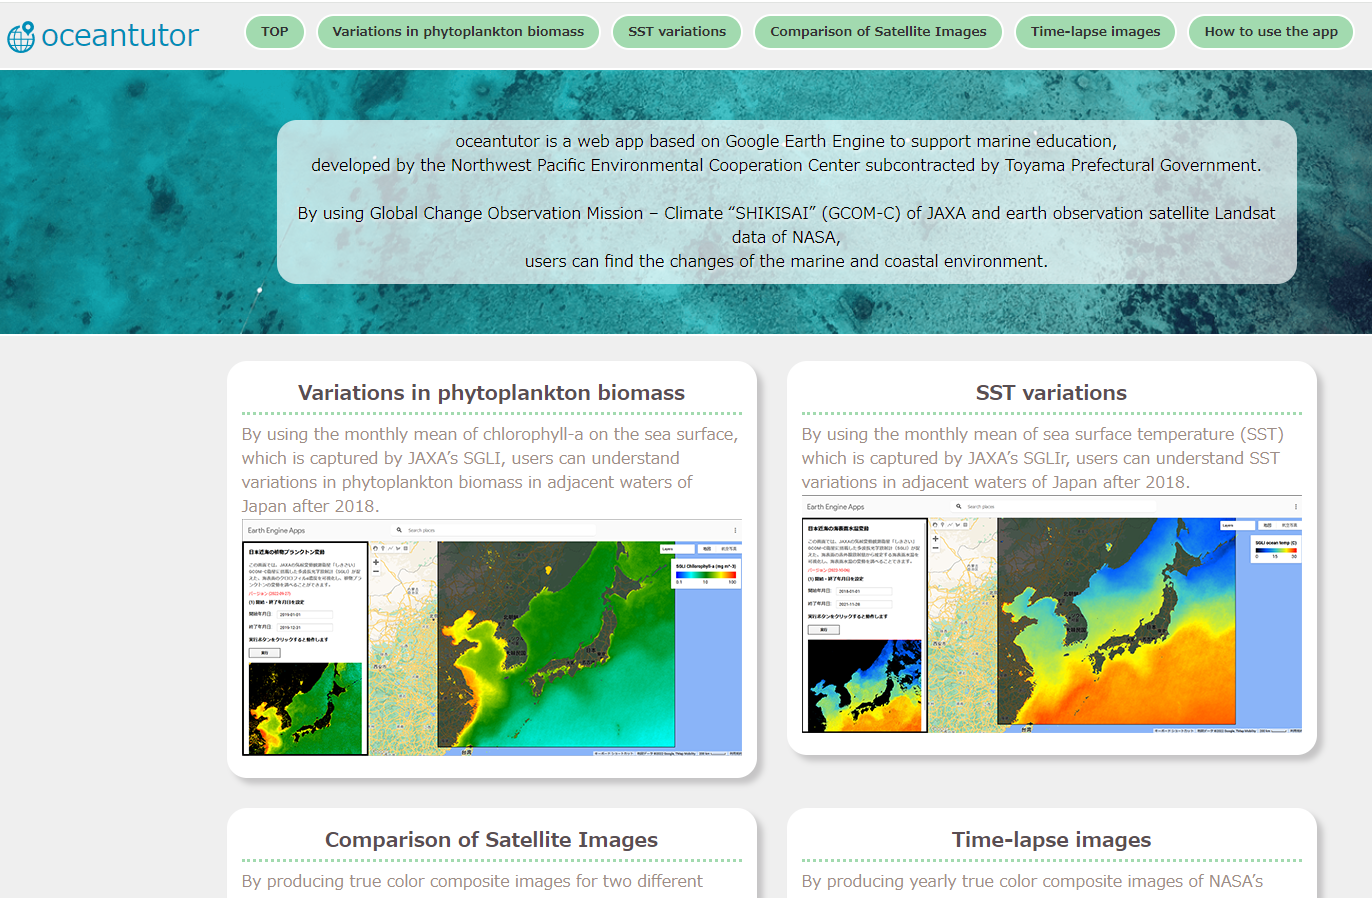
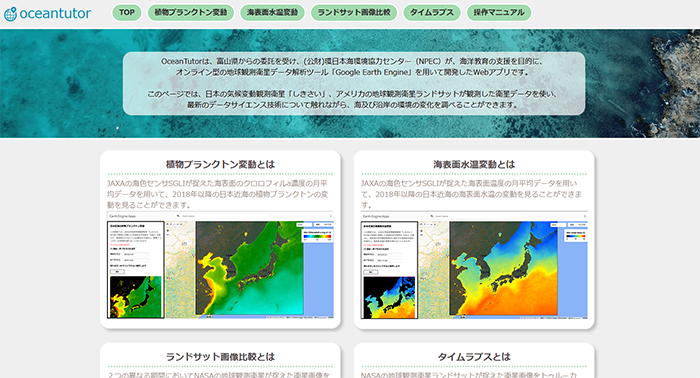
oceantutor is a web app based on Google Earth Engine to support marine education, developed by the Northwest Pacific Environmental Cooperation Center subcontracted by Toyama Prefectural Government.
By using Global Change Observation Mission – Climate “SHIKISAI” (GCOM-C) of JAXA and earth observation satellite Landsat data of NASA, users can find the changes of the marine and coastal environment.
How to use the app:https://www.npec.or.jp/oceantutor/en-index.html
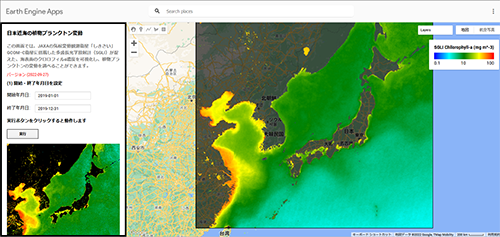
Spring CHL bloom in 2019
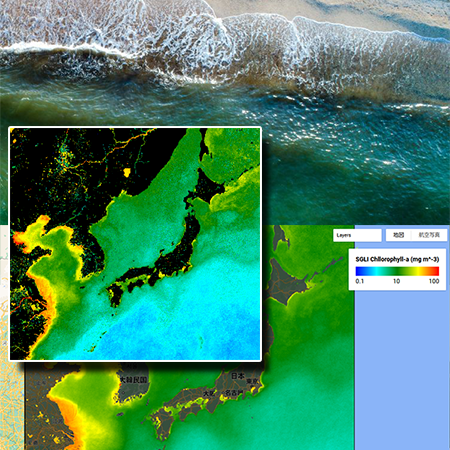
From January to April, the sea area with high chlorophyll-a concentration, which is used as an indicator of phytoplankton, moves northward from the south in the northwest Pacific.
This phenomenon is called “spring CHL bloom,” and it contributes to nurturing marine biodiversity.
By following the steps below, you can replicate the phenomenon within the app.
https://www.npec.or.jp/oceantutor/en-index.html#manu-title7
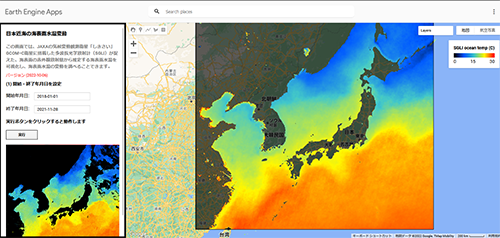
Kuroshio meanderings from 2018 to 2021
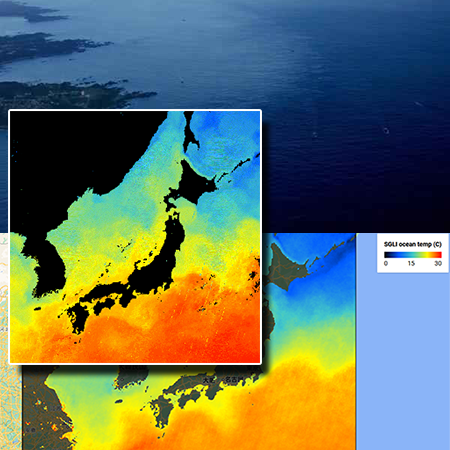
According to the Japan Meteorological Agency (JMA), this large Kuroshio meanderings occurred in September 2017 and has continued by now.
It is well known that Kuroshio meanderings influence on fishery as well as flood disaster and the climate
By following the steps below, you can replicate the phenomenon within the app.
https://www.npec.or.jp/oceantutor/en-index.html#manu-title5
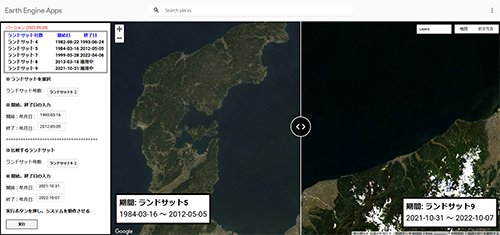
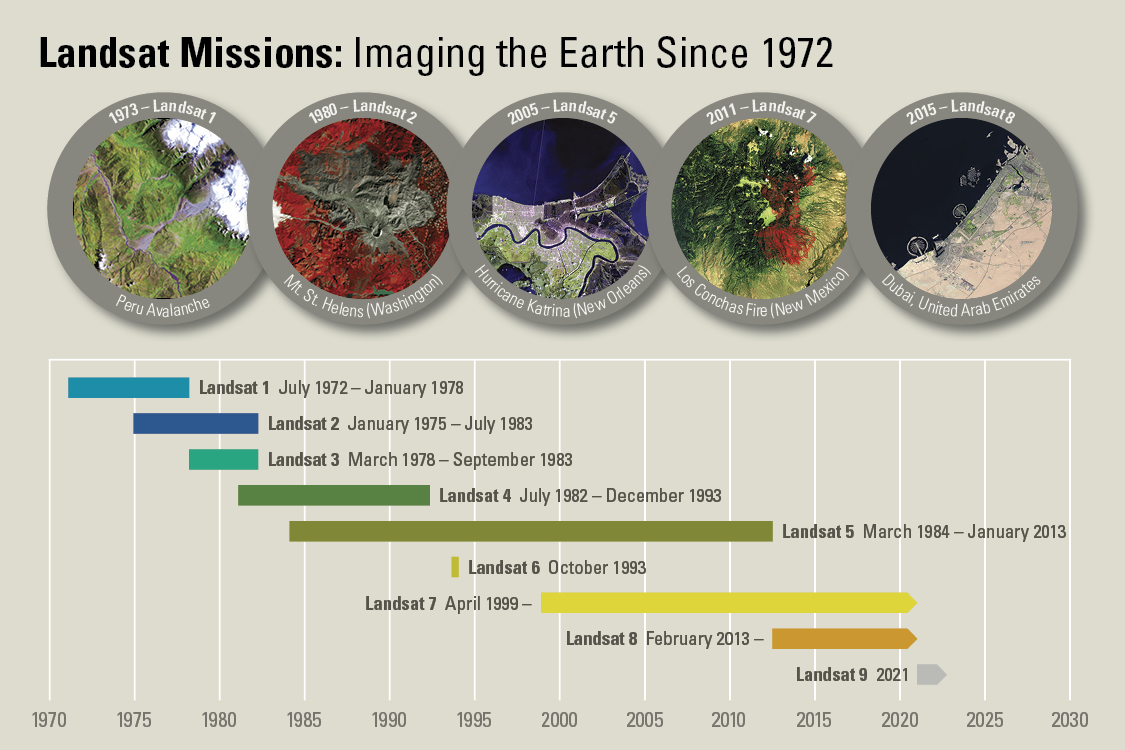
LANDSAT 4 -9
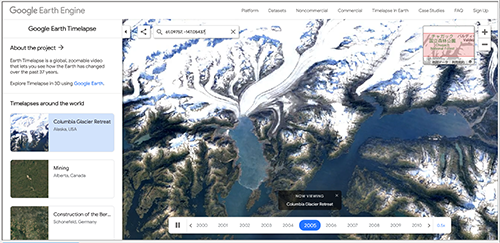
Clouds are removed from the produced yearly data by Google’s algorithm. https://www.npec.or.jp/oceantutor/en-timelapse.html Earth timelapse


