
CEARAC Web-GIS
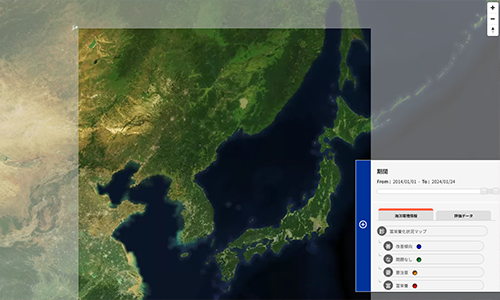
CEARAC Web-GIS https://cearac.nowpap.org/map-webgis/ visualizes the state of the marine environment in the Northwest Pacific region (NOWPAP region) based on the information provided from China, Japan, Korea and Russia.
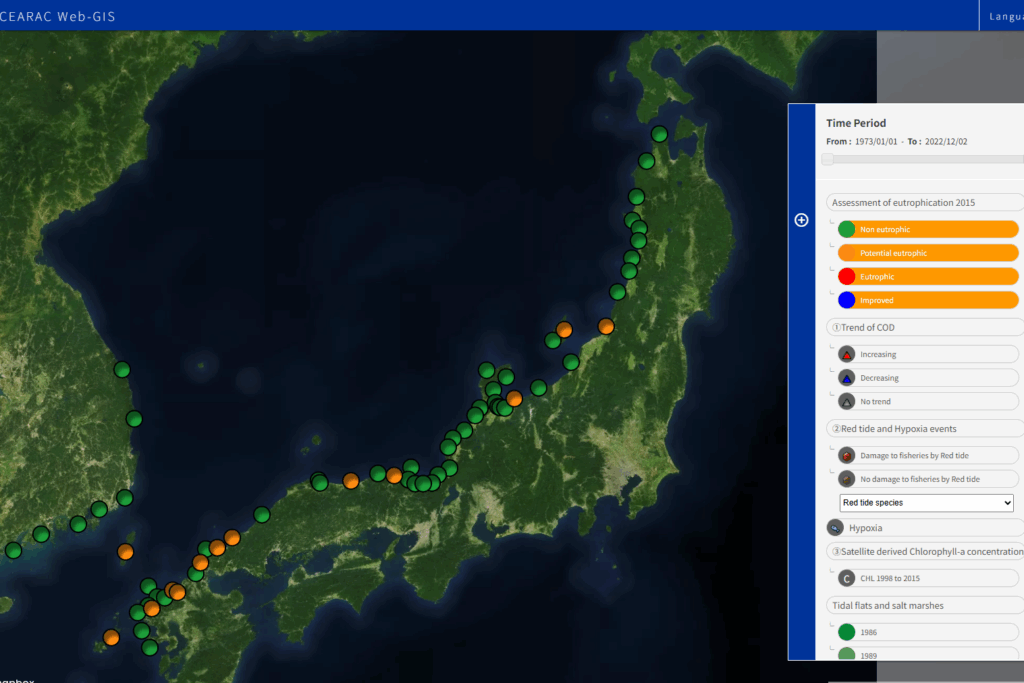
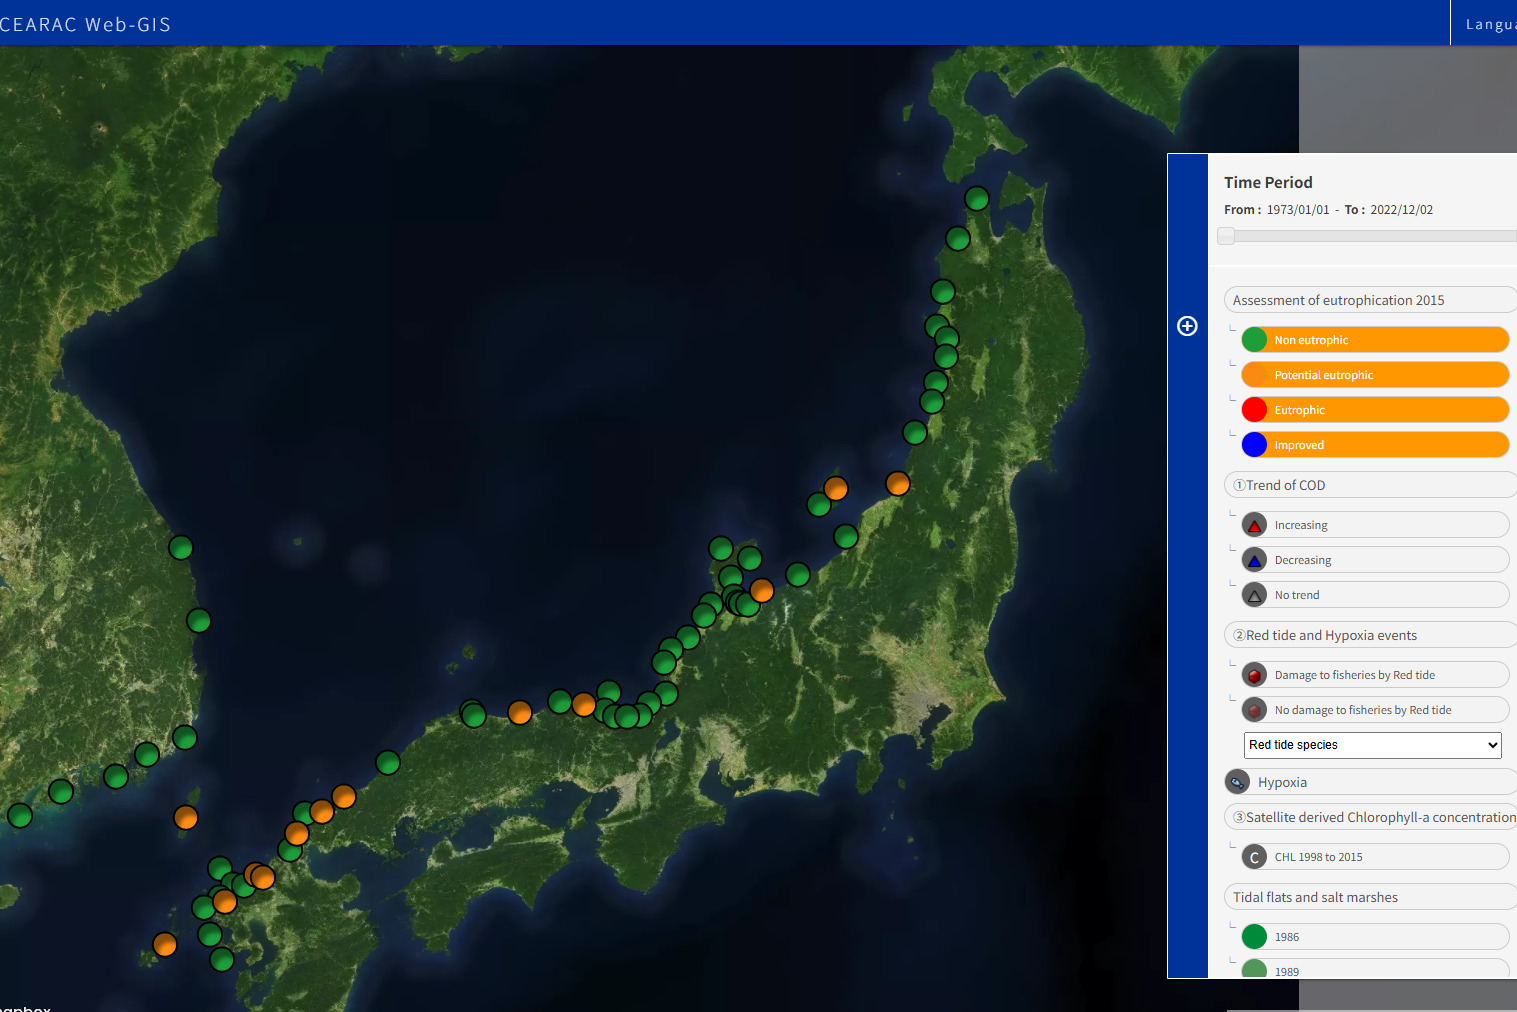
Each item of information in the right table is plotted on the map by icon, color and/or number.
Each item of information in the right table is plotted on the map by icon, color and/or number.
|
Item of CEARAC Web-GIS |
What is shown |
| Assessment of eutrophication 2015 | The status of eutrophication assessed by three minimal parameters in 2015: ①Trend of chemical oxygen demand (COD); ②Red tide and Hypoxia events; and ③Satellite derived chlorophyll-a (CHL) concentration |
| ① Trend of COD | Trend (increase or decrease) of chemical oxygen demand (COD) from 1978 to 2014 |
| ② Red tide and Hypoxia events | – Detailed information of red tide events from 2004 to 2015: area/number of events and with/without fishery damage. – Events can also be shown by causative species. – Areas of hypoxia from 1978 to 2014 |
| ③ Satellite derived chlorophyll-a concentration | 6 categories of satellite-derived chlorophyll-a (CHL) concentration based on the CHL level and trend from 1998 to 2015. See the latest information in Global Eutrophication Watch |
| Tidal flats and Salt marshes | Areas of tidal flats and salt marshes from 1986 to 2019 |
| Seagrass | Areas of seagrass beds (Zostera/Halodule, Phyllospadix, and Halophila) based on the information collected in the literature review activity conducted by the experts in China, Japan, Korea and Russia in 2016-2017. See the list of reviewed literature: Report on the feasibility study towards assessment of seagrass distribution in the NOWPAP region (pp.7-22, Annex II in CEARAC FPM 15, 2017). |


